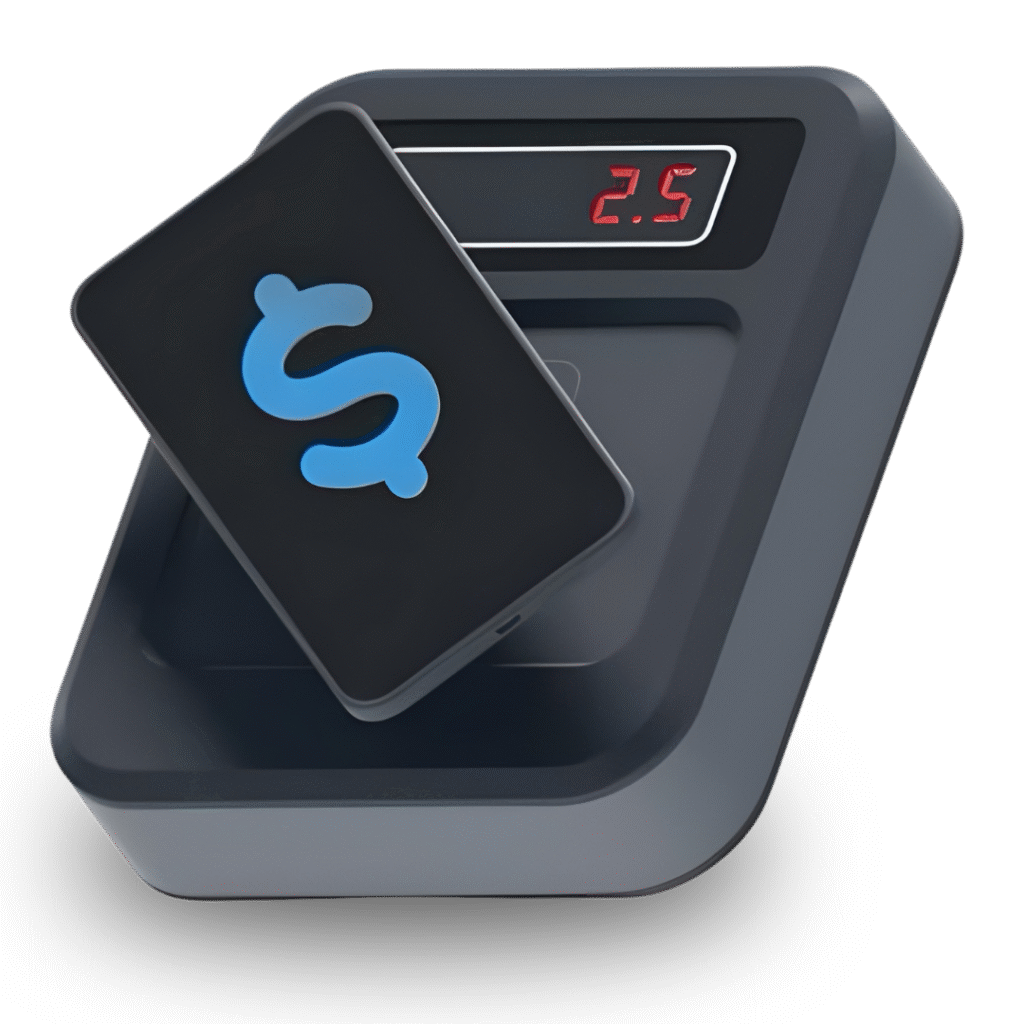


Mobile Trading Dubai: Your Guide to Oil Trading
Introduction to Mobile Trading in Dubai...
Read More
Trading Education Dubai: Ensuring Trading Safety UAE with
Introduction to Trading Education Dubai In...
Read More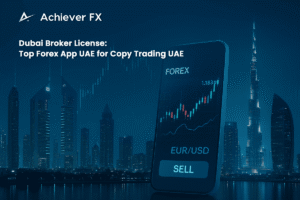
Dubai Broker License: Top Forex App UAE for
In the recent past, there has...
Read More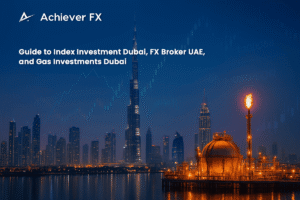
Guide to Index Investment Dubai, FX Broker UAE,
Explore the Best Strategies for Index...
Read More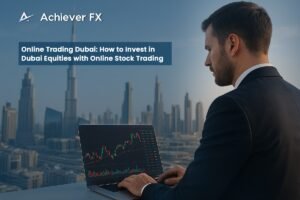
Online Trading Dubai: How to Invest in Dubai
Online Trading Dubai during the past...
Read More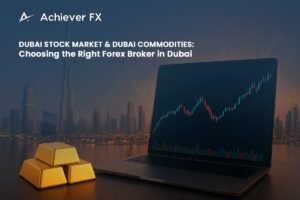
Dubai Stock Market & Dubai Commodities: Choosing the
One of the biggest and most...
Read More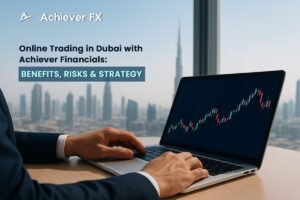
Online Trading in Dubai with Achiever Financials: Benefits,
Online Trading Dubai has become a...
Read More
Step-by-Step Guide: How to Open a Forex Account
It has never been easier to...
Read More
Achiever Financials Dubai: Complete Guide to Forex Trading
Dubai often comes to mind when...
Read More
Achiever Financials Review: Best Forex Broker in Dubai
The world of forex trading is...
Read More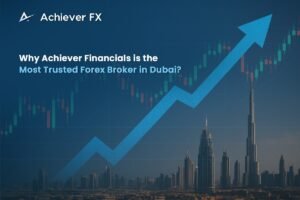
Why Achiever Financials is the Most Trusted Forex
The forex market keeps growing in...
Read More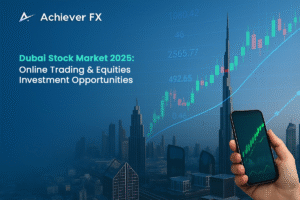
Dubai Stock Market 2025: Online Trading & Equities
The Dubai stock market has entered...
Read More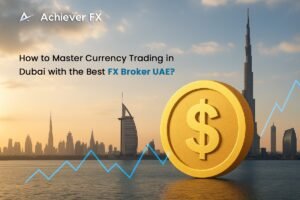
How to Master Currency Trading in Dubai with
Currency trading is one of the...
Read More
Discover the Best Forex Education in Dubai with
The forex market is growing rapidly...
Read More
Gold Trading Dubai and Silver Investment Tips from
Dubai remains a global hub for...
Read More
Forex Broker in Dubai: Your Guide to Safe
The financial markets attract thousands of...
Read More
Why Achiever Financials is the Go-To FX Broker
Currency trading has become one of...
Read More
Forex Dubai Market Trends 2025: What Traders Need
Dubai is becoming a global centre...
Read More
A Beginner’s Guide to Currency Trading in Dubai
Currency trading is also known as...
Read More
Start Currency Trading in Dubai with the Leading
Currency trading has become a popular...
Read More
Why Achiever Financials Is a Trusted Forex Broker
More people in Dubai are turning...
Read More


We Do It
In all Over the World
We trades in all kind of Stocks, Crypto, Commodities, Metals, Instruments & All kind of
potential assets which will gives the profit